Creation of an automatic workflow for a national flood assessment in aotearoa New Zealand
Harang, A.,1 Lane, E. M.,1 Bosserelle, C.,1 Pearson, R.,1 Dean, S.,2 Cattoën, C.,1 Shiona, H.,1 Carey-Smith, T.,2 Smart, G.,1 Srinivasan, R.,2 Wilkins, M.1
1 NIWA Christchurch
2 NIWA Wellington
Alice Harang, NIWA (Christchurch)
Mercredi 24 avril 2024 à 14 h 00
Amphithéâtre Nougaro
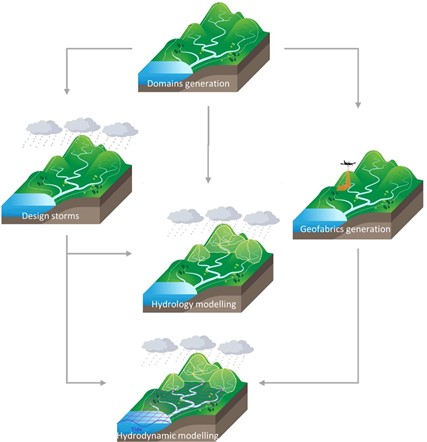
To manage current flood hazard and help develop climate change adaptation strategies, the government-funded project “Mā te haumaru ō ngā puna wai: Increasing flood resilience across Aotearoa” aims to better understand flood hazard and risk across all Aotearoa New Zealand, now and in the future. A crucial part of this project is the generation of nationally consistent flood maps across the whole country for the current climate and future climate projections. To generate these maps, we use a design storm approach and our workflow somewhat mimics the natural water flow cascading down through a hydrological model in the upper catchment and hydrodynamic model on the flood plain (Figure 1).
First, the workflow requires as input the identification of independent floodplains. Each flood plain will be associated to its catchment and be considered a computational unit. For each domain, a design storm is generated for a given scenario (Annual Exceedance Probability, climate projection, antecedent conditions) or an historical storm is used for validation purposes. The runoff and flow routing of streams and rivers on the steep part of the catchment are simulated with the NIWA TopNET model (McMillan et al. 2016). Used uncalibrated, this hydrological model was modified to include a physically realistic soil conductivity and provide a consistent response between gauge and ungauged catchments. The model is spun up to an average base flow with consistent soil and ground water antecedent conditions. The design storm is then run through the model to provide realistic flow boundary conditions to the hydrodynamic model in the populated lower catchment.
Before the inundation modelling, the spatial maps are generated, using the GeoFabrics suite (Pearson et al. 2023), across the lower catchment, based on the latest LiDAR data available and complementary databases such as OpenStreetMap for infrastructure. This process produces a hydrologically conditioned DEM (Digital Elevation Model), including waterways opening and a basic riverbed estimation, associated to a roughness length map. Finally, the flood is simulated using the hydrodynamic model BG_Flood (Bosserelle et al. 2022). The model is a GPU-enabled inundation model using a modern shock-capturing St Venant solver. The model uses a quadtree type mesh that is well suited for GPU computation and allows iterative refinement of the mesh. A first coarse resolution run is used to define the expected flood extent. This flood extent and external data such as stop bank locations, is then used to produce a refinement map defining areas where higher resolution is needed. The model is then run a second time using the variably refined mesh.
This workflow has been validated on several historic flood events including a fluvial flood in Westport, ANZ (56h duration, 60 years return period event), a fluvial and pluvial flood in Waikanae, ANZ (12h duration, 80 years return period event) and the floods in the Hawkes Bay and Tairawhiti regions (ANZ) following the Tropical Cyclone Gabrielle in February 2023 (over 100 years return period flood in some locations).
This workflow is based on open-sources tools; it is modular and automated for continual improvement, to enable data update and to facilitate the creation of new scenarios.